OctaScalp Precision Pro [By TraderMan]What is OctaScalp Precision Pro ? 🚀
OctaScalp Precision is a powerful scalping indicator designed for fast, short-term trades. It combines eight technical indicators to generate 💪 high-accuracy buy 📗 and sell 📕 signals. Optimized for scalpers, this tool targets small price movements in low timeframes (1M, 5M). With visual lines 📈, labels 🎯, and Telegram alerts 📬, it simplifies quick decision-making, enhances risk management, and tracks trade performance.
What Does It Do? 🎯
Fast Signals: Produces reliable buy/sell signals using a consensus of eight indicators.
Risk Management: Offers automated Take Profit (TP) 🟢 and Stop Loss (SL) 🔴 levels with a 2:1 reward/risk ratio.
Trend Confirmation: Validates short-term trends with a 30-period EMA zone.
Performance Tracking: Records trade success rates (%) and the last 5 trades 📊.
User-Friendly: Displays market strength, signal type, and trade details in a top-right table.
Alerts: Sends Telegram-compatible notifications for new positions and trade results 📲.
How Does It Work? 🛠️
OctaScalp Precision integrates eight technical indicators (RSI, MACD, Stochastic, Momentum, 200-period EMA, Supertrend, CCI, OBV) for robust analysis. Each indicator contributes 0 or 1 point to a bullish 📈 or bearish 📉 score (max 8 points). Signals are generated as follows:
Buy Signal 📗: Bullish score ≥6 and higher than bearish score.
Sell Signal 📕: Bearish score ≥6 and higher than bullish score.
EMA Zone 📏: A zone (default 0.1%) around a 30-period EMA confirms trends. Price staying above or below the zone for 4 bars validates the direction:
Up Direction: Price above zone, color green 🟢.
Down Direction: Price below zone, color red 🔴.
Neutral: Price within zone, color gray ⚪.
Entry/Exit: Entries are triggered on new signals, with TP (2% profit) and SL (1% risk) auto-calculated.
Table & Alerts: Displays market strength (% bull/bear), signal type, entry/TP/SL, and success rate in a table. Telegram alerts provide instant notifications.
How to Use It? 📚
Setup 🖥️:
Add the indicator to TradingView and use default settings or customize (EMA length, zone width, etc.).
Best for low timeframes (1M, 5M).
Signal Monitoring 🔍:
Check the table: Bull Strength 📗 and Bear Strength 📕 percentages indicate signal reliability.
Confirm Buy (📗 BUY) or Sell (📕 SELL) signals when trendSignal is 1 or -1.
Entering a Position 🎯:
Buy: trendSignal = 1, bullish score ≥6, and higher than bearish score, enter at the entry price.
Sell: trendSignal = -1, bearish score ≥6, and higher than bullish score, enter at the entry price.
TP and SL: Follow the green (TP) 🟢 and red (SL) 🔴 lines on the chart.
Exiting 🏁:
If price hits TP, trade is marked ✅ successful; if SL, marked ❌ failed.
Results are shown in the “Last 5 Trades” 📜 section of the table.
Setting Alerts 📬:
Enable alerts in TradingView. Receive Telegram notifications for new positions and trade outcomes.
Position Entry Strategy 💡
Entry Conditions:
For Buy: Bullish score ≥6, trendSignal = 1, price above EMA zone 🟢.
For Sell: Bearish score ≥6, trendSignal = -1, price below EMA zone 🔴.
Check bull/bear strength in the table (70%+ is ideal for strong signals).
Additional Confirmation:
Use on high-volume assets (e.g., BTC/USD, EUR/USD).
Validate signals with support/resistance levels.
Be cautious in ranging markets; false signals may increase.
Risk Management:
Stick to the 2:1 reward/risk ratio (TP 2%, SL 1%).
Limit position size to 1-2% of your account.
Tips and Recommendations 🌟
Best Markets: Ideal for volatile markets (crypto, forex) and low timeframes (1M, 5M).
Settings: Adjust EMA length (default 30) or zone width (0.1%) based on the market.
Backtesting: Test on historical data to evaluate success rate 📊.
Discipline: Follow signals strictly and avoid emotional decisions.
OctaScalp Precision makes scalping fast, precise, and reliable! 🚀
Komut dosyalarını "RSI MACD" için ara

Dynamic Fib Zones [By TraderMan]📊 Dynamic Fib Zones — Indicator Overview
This indicator automatically plots dynamic Fibonacci levels and zones on your chart based on recent price action, volume, and trend direction. It helps you identify key support and resistance areas where price may react strongly.
🔍 What Does It Do?
Draws Fibonacci retracement levels dynamically over a specified lookback period.
Highlights zones around these Fibonacci levels to give you a price “buffer area” instead of just a line.
Colors the zones green or red based on volume strength and trend direction to signal potential buying or selling pressure.
Uses EMA (Exponential Moving Average) to detect if the trend is up or down.
Shows labels with Fibonacci % levels and exact price for quick reference.
⚙️ How to Use It?
Set your inputs:
Fibonacci Period: How many bars back the Fibonacci levels are calculated.
EMA Period: For trend detection.
Volume Multiplier: How much volume should exceed average to consider the signal strong.
Level Tolerance and Zone Width: Adjust the sensitivity and size of the price zones.
Interpret zones:
Green zones with high volume and price near Fibonacci level in an uptrend = potential buying area.
Red zones with high volume and price near Fibonacci level in a downtrend = potential selling area.
Gray zones = neutral, no strong signal.
Make your trading decisions:
Consider entering long positions near green zones with confirmation from other indicators or price action.
Consider entering short positions near red zones similarly.
Use zone boundaries as dynamic support/resistance for stop loss or take profit placement.
🚀 Tips for Position Opening
Combine with other confirmation tools (candlestick patterns, RSI, MACD, etc.) to avoid false signals.
Watch volume spikes carefully; strong volume near a Fibonacci zone increases the reliability.
Use the EMA trend filter to avoid trading against the main trend.
🎯 Summary
Dynamic Fib Zones give you a powerful, visual edge by combining Fibonacci, volume, and trend signals — making your entries and exits smarter and more precise!
Happy Trading! 📈✨

TrendGradient [By TraderMan]TrendGradient Indicator: What It Does, How It Works, and How to Use It 📊✨
The **TrendGradient ** indicator is a Pine Script tool designed for the TradingView platform, assisting traders in trend analysis, generating buy/sell signals, and determining target price (TP) and stop-loss (SL) levels. In this guide, I’ll explain in detail what the indicator does, how it operates, how to use it, and strategies for opening positions. Get ready to dive into this colorful and powerful tool! 🚀
🌟 **What Is TrendGradient and What Does It Do?**
TrendGradient is an indicator that analyzes price movements to identify trend direction and strength while generating actionable buy and sell signals. Here are its core functions:
1. **Trend Tracking**: Uses 38-period and 62-period Exponential Moving Averages (EMAs) to determine the trend direction (bullish or bearish).
2. **Buy/Sell Signals**: Generates signals based on EMA crossovers and crossunders.
3. **Target and Stop Levels**: Calculates entry, take-profit (TP1, TP2, TP3), and stop-loss (SL) levels using the Average True Range (ATR).
4. **Volatility and Trend Analysis**: Visualizes volatility levels (low, medium, high) and trend strength (strong/weak) via ATR and EMA.
5. **Visual Clarity**: Provides a user-friendly interface with colored lines, labels, tables, and shapes.
This indicator is ideal for trend-following traders and can be used for both short-term (scalping/day trading) and long-term strategies. 📈
---
### 🛠️ **How Does TrendGradient Work?**
Let’s break down the indicator’s mechanics step by step:
#### 1. **EMA-Based Trend Analysis** 📉
- **EMA 38 and EMA 62**: The indicator uses 38-period and 62-period Exponential Moving Averages to smooth price data and identify trend direction.
- **EMA 38 > EMA 62**: Bullish trend (uptrend) 📈
- **EMA 38 < EMA 62**: Bearish trend (downtrend) 📉
- EMA crossovers trigger buy/sell signals:
- **Crossover (EMA 38 crosses above EMA 62)**: Buy signal (BUY).
- **Crossunder (EMA 38 crosses below EMA 62)**: Sell signal (SELL).
- The EMAs focus on the last 20 days of data to display recent trends only.
#### 2. **ATR-Based Levels** ⚖️
- **ATR (Average True Range)**: Measures price volatility and is used to calculate entry, TP, and SL levels.
- **Entry Price**: For buys, the closing price plus an ATR multiplier; for sells, the closing price minus an ATR multiplier.
- **Take-Profit Levels (TP1, TP2, TP3)**: Calculated by adding/subtracting ATR multiples (default: 2.0, 4.0, 6.0) to/from the entry price.
- **Stop-Loss (SL)**: Set at a distance from the entry price using an ATR multiplier (default: 2.0 + additional SL).
- These levels are visualized on the chart with colored lines (yellow: entry, green: TP1, teal: TP2, blue: TP3, red: SL) and labels.
#### 3. **Signal and Status Visualization** 🖼️
- **Lines and Labels**: Buy/sell signals are marked with green "BUY" and red "SELL" labels on the chart.
- **Table**: A table in the top-right corner summarizes signal status, entry/TP/SL levels, trend strength, volatility, and trend direction.
- **Color Coding**:
- Green: Bullish trend, buy signal, or TP achievements.
- Red: Bearish trend, sell signal, or SL triggered.
- Yellow, teal, blue: Entry and TP levels.
- **Bar Coloring**: Bars are colored green (bullish) or red (bearish) based on EMA alignment.
#### 4. **TP/SL Monitoring** ✅❌
- The indicator checks if the price hits TP or SL levels and displays labels like "✔️ TP Achieved" or "❌ SL Stopped Out."
- When a TP or SL is hit, the position status updates (e.g., "In Progress ⏳", "Successful ✅", or "Failed ❌").
#### 5. **Volatility and Trend Strength** 📊
- **Volatility (ATR)**: Classified as "Low" (red), "Medium" (orange), or "High" (green) based on the ATR’s position within its 50-bar range.
- **Trend Strength**: If EMA 38 > EMA 62, the trend is "Strong" (green); otherwise, it’s "Weak" (red).
---
### 📋 **How to Use TrendGradient?**
Follow these steps to effectively use TrendGradient:
#### 1. **Add the Indicator to TradingView** 🖥️
- In TradingView, search for "TrendGradient " in the **Indicators** menu and add it to your chart.
- Use default settings or customize parameters like ATR period, multipliers, and display duration (default: 20 days) in the **Settings** menu.
#### 2. **Identify Signals** 🔍
- **Buy Signal (BUY)**: Appears when a green "BUY" label is displayed and EMA 38 crosses above EMA 62.
- **Sell Signal (SELL)**: Appears when a red "SELL" label is displayed and EMA 38 crosses below EMA 62.
- Check the top-right table for signal status ("BUY", "SELL", or "-") and position levels (Entry, TP1, TP2, TP3, SL).
#### 3. **Opening a Position** 🚪
- **Long Position (Buy)**:
1. When a "BUY" signal appears, check the entry price (yellow line).
2. Open a position at or near the entry price.
3. Set TP1, TP2, TP3 (green, teal, blue lines) and SL (red line) as targets/stops.
- **Short Position (Sell)**:
1. When a "SELL" signal appears, check the entry price.
2. Open a position at or near the entry price.
3. Use TP and SL levels as targets/stops.
- **Note**: ATR-based levels adjust dynamically to market volatility, ensuring adaptability.
#### 4. **Position Management** 🛡️
- **Take-Profit (TP)**: Realize profits when the price hits TP1, TP2, or TP3. For example, close part of the position at TP1 and hold the rest for TP2/TP3.
- **Stop-Loss (SL)**: Close the position if the price hits the SL level ("❌ SL Stopped Out" appears).
- **Partial Closes**: Use multiple TP levels to scale out of positions incrementally.
#### 5. **Trend and Volatility Analysis** 📊
- **Trend Direction and Strength**: The table shows whether the trend is "Up" or "Down" and its strength ("Strong" or "Weak"). Strong trends may warrant more aggressive positions.
- **Volatility**: ATR-based volatility indicators help gauge market conditions. High volatility (green) suggests larger price moves, while low volatility (red) indicates calmer markets.
#### 6. **Risk Management** ⚠️
- Always use the SL level and assess the risk/reward ratio (e.g., 2:1 for TP1, 4:1 for TP2).
- In low volatility (red), consider smaller positions; in high volatility (green), expect larger moves.
---
### 🛠️ **Example Position Opening Scenario**
**Scenario: Long Position**
- **Situation**: EMA 38 crosses above EMA 62, and a green "BUY" label appears.
- **Entry Price**: 100 (yellow line).
- **TP Levels**: TP1: 104, TP2: 108, TP3: 112.
- **SL Level**: 96.
- **Strategy**:
1. Open a long position at 100.
2. Close 50% of the position at TP1 (104), hold the rest for TP2 (108) or TP3 (112).
3. Exit fully if the price hits SL (96).
- **Table Status**: "Signal: BUY", "Position Status: In Progress ⏳", "Trend Strength: Strong", "Volatility: High".
**Scenario: Short Position**
- **Situation**: EMA 38 crosses below EMA 62, and a red "SELL" label appears.
- **Entry Price**: 100.
- **TP Levels**: TP1: 96, TP2: 92, TP3: 88.
- **SL Level**: 104.
- **Strategy**: Manage the position similarly, scaling out at TP levels.
---
### 💡 **Tips and Suggestions**
1. **Timeframe**: The indicator works across timeframes (1H, 4H, daily). Short-term traders can use 1H-4H, while long-term traders may prefer daily charts.
2. **Combine with Other Indicators**: Use RSI, MACD, or support/resistance levels to confirm signals.
3. **Backtesting**: Test the strategy on historical data to evaluate performance.
4. **Customization**: Adjust ATR multipliers or EMA periods to suit your market or strategy.
5. **Discipline**: Stick to signals and avoid emotional decisions.
---
### 🎨 **Visual Features**
- **Colored Lines and Labels**: Entry, TP, and SL levels are displayed with colored lines (yellow, green, teal, blue, red) for clarity.
- **Table**: The top-right table summarizes all key information (signal, levels, trend, volatility).
- **Bar Coloring**: Green bars for bullish trends and red bars for bearish trends make trend direction easy to spot.
- **Emojis**: Position status is enhanced with emojis like ⏳ (in progress), ✅ (successful), and ❌ (failed) for visual appeal.
---
### ⚠️ **Warnings and Limitations**
- **Market Conditions**: The indicator performs best in trending markets; it may produce false signals in ranging markets.
- **Risk Management**: Always use proper risk/reward ratios and risk only a small portion of your capital.
- **Lag**: EMAs are lagging indicators, so signals may be delayed in fast-moving markets.
- **Customization Needs**: Default settings may not suit all markets; test and optimize as needed.
---
### 🌟 **Conclusion**
TrendGradient is a user-friendly, visually appealing indicator for trend tracking and automated level calculation. It generates signals via EMA crossovers, calculates dynamic TP/SL levels with ATR, and presents all information clearly through tables, lines, and labels. By using this tool with discipline, you can make more informed and successful trading decisions! 🚀
If you have further questions or need help customizing the indicator, feel free to ask! 💬 Good luck and happy trading! 🍀

EMA ZONE MASTER [By TraderMan]🟢 EMA Zone Master Indicator Explanation 🚀
🌟 What is the EMA Zone Master?
The EMA Zone Master is a powerful TradingView Pine Script indicator designed to help traders identify trends, entry points, and manage trades with precision. It leverages a 200-period EMA (Exponential Moving Average) to create a dynamic zone for spotting bullish 📈 and bearish 📉 trends. The indicator provides clear buy/sell signals, take-profit (TP) levels, and stop-loss (SL) levels, making it ideal for both novice and experienced traders! 💪
🔍 How Does It Work?
The indicator uses the 200-period EMA as its core, surrounded by a zone defined by a percentage offset (default 0.3%). Here's how it operates:
Trend Detection 🧠:
The price's position relative to the EMA zone determines the trend:
Above the zone (with tolerance and minimum distance) signals a bullish trend (BUY 📈).
Below the zone signals a bearish trend (SELL 📉).
A neutral trend occurs when the price is within the zone or lacks momentum.
A trend is confirmed after a set number of bars (default 3) to filter out noise. 🔎
Trade Signals 🚦:
Buy Signal: Triggered when the price breaks above the EMA zone with confirmation.
Sell Signal: Triggered when the price breaks below the EMA zone with confirmation.
Signals are visualized with labels ("BUY" or "SELL") on the chart for clarity. ✅
Position Management 🎯:
Entry Price: Set at the closing price when a signal is triggered.
Take-Profit Levels: Three TP levels (TP1, TP2, TP3) are calculated based on a Risk/Reward Ratio (default 0.7).
Stop-Loss: Calculated using the ATR (Average True Range) with a multiplier (default 6.0) for volatility-based protection. 🛡️
Lines and labels for entry, TP, and SL are drawn on the chart for easy tracking.
Trend Strength 💪:
The indicator calculates trend strength (0-100%) and categorizes it as Very Strong, Strong, Moderate, Weak, or Very Weak. This helps gauge the reliability of the trend. 🌡
Analysis Comment 📝:
A dynamic comment provides professional insights based on trend strength, guiding traders on whether to act or wait. 🧑💼
Visuals & Alerts 🔔:
The EMA, zone boundaries, and candlestick colors change based on the trend (green for bullish, red for bearish, gray for neutral).
A table in the top-right corner summarizes key data: trend direction, strength, entry price, TP/SL levels, and success rate.
Alerts are generated with detailed trade information when a new signal appears.
🛠 How to Use It?
Setup on TradingView ⚙️:
Add the EMA Zone Master to your chart via the TradingView Pine Script editor.
Customize settings like EMA Length (default 200), Zone Width (0.3%), ATR Period (50), and Risk/Reward Ratio (0.7) to suit your trading style. 🛠
Interpreting Signals 📊:
Buy Signal (AL): Look for a "BUY" label and green candlesticks when the price breaks above the EMA zone. 📈
Sell Signal (SAT): Look for a "SELL" label and red candlesticks when the price breaks below the EMA zone. 📉
Check the table for trend strength and analysis comments to confirm the signal's reliability.
Opening a Position 💸:
Long Position: Enter a buy trade when a "BUY" signal appears. Set your take-profit at TP1, TP2, or TP3 and stop-loss at the SL level shown on the chart.
Short Position: Enter a sell trade when a "SELL" signal appears. Use the TP and SL levels provided.
The indicator automatically plots these levels as lines and labels for easy reference. 🎯
Managing Trades 🕒:
Monitor the trade's progress via the table and labels.
The indicator tracks if TP1, TP2, or TP3 is hit or if the trade stops out, updating the Last Result in the table (e.g., "✅ TP1 SUCCESS" or "❌ STOPPED OUT").
Use the Success Rate (displayed in the table) to gauge historical performance (75% for BUY, 65% for SELL, 50% for NEUTRAL).
Using Alerts 🔔:
Set up alerts in TradingView to receive notifications when a buy or sell signal is triggered.
The alert message includes the trend, strength, entry price, TP/SL levels, success rate, and analysis comment for quick decision-making.
📈 How to Open a Position?
Wait for a Signal: Ensure a "BUY" or "SELL" label appears, and the trend strength is at least Moderate (40%+) for higher confidence. ✅
Check the Table: Review the trend direction, strength, and analysis comment to confirm the trade setup. 📊
Enter the Trade:
For a Buy: Enter at the entry price shown, set TP1/TP2/TP3 and SL as indicated by the lines/labels.
For a Sell: Same process, but for a short position.
Monitor: Watch for TP or SL hits. The indicator will update the table with the result (e.g., "✅ TP3 SUCCESS"). 🕒
Risk Management: Always adhere to the stop-loss level to limit losses, and consider partial profit-taking at TP1 or TP2 for safer trading. 🛡️
🎉 Why Use EMA Zone Master?
Clear Signals: Easy-to-read buy/sell signals with visual cues. 🚦
Automated Levels: Pre-calculated TP and SL levels save time and reduce errors. 🧮
Trend Strength Insight: Helps avoid weak trends and focus on high-probability setups. 💪
Professional Analysis: Dynamic comments guide your trading decisions. 🧑💼
Customizable: Adjust settings to match your trading style or market conditions. ⚙️
Alert System: Stay informed with detailed alerts for timely action. 🔔
⚠️ Tips for Success
Confirm with Other Tools: Use additional indicators (e.g., RSI, MACD) to validate signals. 🔍
Test First: Backtest the indicator on your preferred market/timeframe to understand its performance. 📉
Risk Management: Always use proper position sizing and respect stop-loss levels. 🛑
Higher Timeframes: The indicator works best on higher timeframes (e.g.,15MİN, 1H, 4H, Daily) for stronger signals. ⏰
Happy trading with EMA Zone Master! 🚀 Let it guide you to smarter, more confident trades. 💰 Feel free to tweak settings and share your results! 😊

Universal Futures Signals Pro – Next-Gen Day Trading IndicatorThe Universal Futures Signals Pro is a powerful, all-in-one day trading toolkit designed for futures traders seeking precision, confidence, and consistency. Whether you're trading ES, MES, NQ, MNQ, or other popular futures contracts, this indicator delivers real-time signals and advanced analytics tailored for high-performance intraday trading.
🔍 Key Features:
Smart Buy/Sell Signals based on multi-factor confluence (trend, momentum, volume, volatility).
EMA, VWAP, RSI, MACD & Order Block integration for accurate signal generation.
Signal Clustering Detector to identify high-probability trade zones.
Dynamic Risk Management: Helps define stop loss and target areas for funded evaluations.
Session Filters (RTH, ETH) and Smart Money Concepts for cleaner setups.
Professional Dashboard showing trend state, trade status, and signal count.
Alerts for trade entries, exits, signal clusters, and trend shifts.
Customizable Settings: Tailor everything from sensitivity to color schemes.
Who is it for?
Prop firm traders looking to pass evaluation accounts.
Futures scalpers and intraday traders who value precision.
Traders seeking a structured edge in volatile markets.
Works Best On:
Instruments: ES, MES, NQ, MNQ, RTY, YM, CL, GC, etc.
Timeframes: 1m to 15m (optimized for intraday precision)

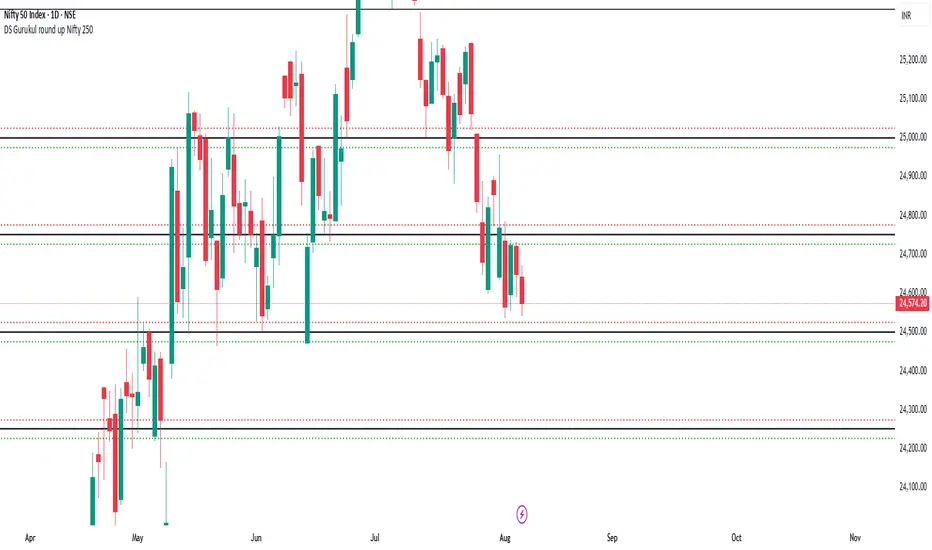
DS Gurukul round up Nifty 250Roundup (Support & Resistance Indicator) For Nifty 50
By DS Gurukul
Version : 1.0
To be used only for Nifty 50.
Indicator Overview
The Round Figure Indicator identifies key psychological support and resistance levels based on round numbers. These levels often act as strong turning points in price action due to trader psychology and institutional order placement.
How It Works
Key Levels:
Mid Band (Black Solid Line): Major round number
Upper Band (Green Solid Line): Mid Band (resistance)
Lower Band (Red Solid Line): Mid Band (support)
Sub-Bands (Dotted Lines): ±0.10 levels for tighter zones
Alerts: Triggers when price touches any band, signaling potential reversals or breakouts.
Trading Strategy
✅ Bounce Trades:
Buy near Lower Band or Mid Sub-Lower with bullish confirmation (e.g., hammer candle).
Sell near Upper Band or Mid Sub-Upper with bearish rejection (e.g., shooting star).
✅ Breakout Trades:
Enter long on a close above Upper Band with volume.
Enter short on a close below Lower Band with momentum.
⚠️ Risk Management:
Place stops just beyond the opposite sub-band.
Avoid trading if price is stuck between mid/sub-bands (choppy market).
Why It Works
Round numbers attract limit orders (support/resistance).
Institutions use these levels for stop placements and profit targets.
Works across all timeframes (scalping to swing trading).
🔔 Tip: Combine with RSI/MACD for higher-probability trades!
DS Gurukul round up Bank 500Roundup (Support & Resistance Indicator) For Bank Nifty
By DS Gurukul
Version : 1.0
To be used only for Bank Nifty.
Indicator Overview
The Round Figure Indicator identifies key psychological support and resistance levels based on round numbers. These levels often act as strong turning points in price action due to trader psychology and institutional order placement.
How It Works
Key Levels:
Mid Band (Black Solid Line): Major round number
Upper Band (Green Solid Line): Mid Band (resistance)
Lower Band (Red Solid Line): Mid Band (support)
Sub-Bands (Dotted Lines): ±0.10 levels for tighter zones
Alerts: Triggers when price touches any band, signaling potential reversals or breakouts.
Trading Strategy
✅ Bounce Trades:
Buy near Lower Band or Mid Sub-Lower with bullish confirmation (e.g., hammer candle).
Sell near Upper Band or Mid Sub-Upper with bearish rejection (e.g., shooting star).
✅ Breakout Trades:
Enter long on a close above Upper Band with volume.
Enter short on a close below Lower Band with momentum.
⚠️ Risk Management:
Place stops just beyond the opposite sub-band.
Avoid trading if price is stuck between mid/sub-bands (choppy market).
Why It Works
Round numbers attract limit orders (support/resistance).
Institutions use these levels for stop placements and profit targets.
Works across all timeframes (scalping to swing trading).
🔔 Tip: Combine with RSI/MACD for higher-probability trades!

Live Market - Performance MonitorLive Market - Performance Monitor – Study Material & Usage Guide
Overview:
The Live Market - Performance Monitor is a multi-layered TradingView indicator that assists traders in identifying high-probability setups by combining key technical elements: order block detection, dynamic trendline analysis, volume and volatility filtering, signal validation, and ATR-based target projection. This guide provides the essential logic, formulas, and practical steps to help users apply the system effectively.
________________________________________
Key Functional Features and Formulas
________________________________________
1. Order Block Detection
The indicator identifies price zones where strong institutional buying or selling has likely occurred, based on candle sequences.
• User Input: Number of consecutive candles to define relevance (e.g., 3–7 bars)
• Validation Formula:
• Price Move % = |Close(n) - Close(1)| / Close(n) × 100
• Bullish Order Block: A bearish candle followed by consecutive bullish candles
• Bearish Order Block: A bullish candle followed by consecutive bearish candles
Only valid zones that meet a minimum price move threshold are retained and plotted.
________________________________________
2. Trendline Logic
Trendlines are dynamically plotted using price pivots.
• Pivot Calculation: Highs and lows over a lookback period (e.g., 10 bars)
• Trendline Slope:
• Slope = (Pivot_new - Pivot_old) / (Time_new - Time_old)
• Trendline Projection:
• Projected Price = StartPrice + Slope × (CurrentTime - StartTime)
These lines act as dynamic support/resistance zones and are used to confirm breakout trades.
________________________________________
3. Volume and ATR Filters
Signals are filtered using real-time volume and volatility analysis to eliminate low-quality setups.
• Average Volume:
• AvgVol = SMA(Volume, 20)
• Volume Spike Condition:
• Volume > AvgVol × VolumeThreshold
• ATR (Volatility Filter) – Calculated using 14-bar period:
• (High - Low) > ATR × ATRMultiplier
When both filters are passed, the market is considered active and valid for trade.
________________________________________
4. Signal Generation Logic
• Bullish Signal: Triggered when:
o Price breaks above a resistance zone or bullish order block
o Volume and ATR filters confirm activity
o Trend alignment: EMA9 > EMA21 > EMA50
• Bearish Signal: Triggered under opposite conditions:
o Price breaks below a support zone or bearish order block
o Trend alignment: EMA9 < EMA21 < EMA50
Labels such as "BUY" or "SELL" appear on the chart at the trigger candle.
________________________________________
5. Target and Stop Loss Projection
The script dynamically calculates TP (take profit) and SL (stop loss) levels based on the ATR.
• For Long Trades:
• TP = High + (ATR × 2)
• SL = Low - (ATR × 1)
• For Short Trades:
• TP = Low - (ATR × 2)
• SL = High + (ATR × 1)
These levels are plotted on the chart and adjust as price evolves.
________________________________________
6. Performance Tracking
The script automatically tracks wins and losses for each signal based on TP/SL outcomes.
• Win Rate Formula:
• Win Rate (%) = (Number of Wins / Total Signals) × 100
This is useful for evaluating the system over time and adjusting risk or position sizing.
________________________________________
Practical Usage Steps
1. Apply the Indicator
o Add to your chart via Pine Editor or Indicators menu.
o Configure all input parameters including OB periods, pivot lookback, volume threshold, and ATR multiplier.
2. Signal Monitoring
o Wait for a "BUY" or "SELL" label to appear on the chart.
o Confirm alignment using:
EMA trend stacking (e.g., EMA9 > EMA21 > EMA50)
RSI/MACD momentum
Volume and ATR filters
3. Trade Execution
o Enter the trade on the candle following the signal.
o Use the plotted TP/SL lines to manage the trade.
o Monitor price action; exit if trend shifts or targets are achieved.
4. Review Performance
o Use the win rate and PnL counters to monitor your success.
o Analyze losing trades for trend or filter failures and optimize settings accordingly.
________________________________________
Alerts
The script includes alert support for:
• Signal Triggers: BUY or SELL label detection
• Take Profit / Stop Loss Hits: Automatically notifies when TP or SL is reached
These can be configured for push, email, or webhook delivery via TradingView alert settings.
________________________________________
Disclaimer from aiTrendview
This tool and the content provided by aiTrendview.com are for educational and research purposes only. They do not constitute investment advice, trading recommendations, or financial guidance. All forms of trading involve significant risk. Past performance does not guarantee future outcomes. Users are fully responsible for their trading decisions, including risk management, position sizing, and due diligence. It is strongly advised to test all strategies on a demo account before applying them to live capital. Consult a licensed financial advisor if necessary.

Multi-Indicator Market SignalMulti-Indicator Market Signal with rsi , macd ,volume buy and sell signal
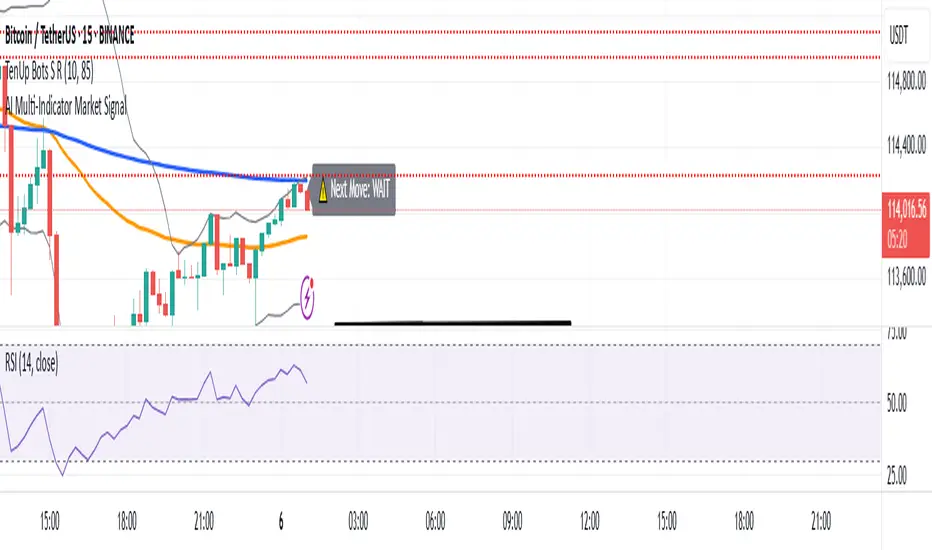
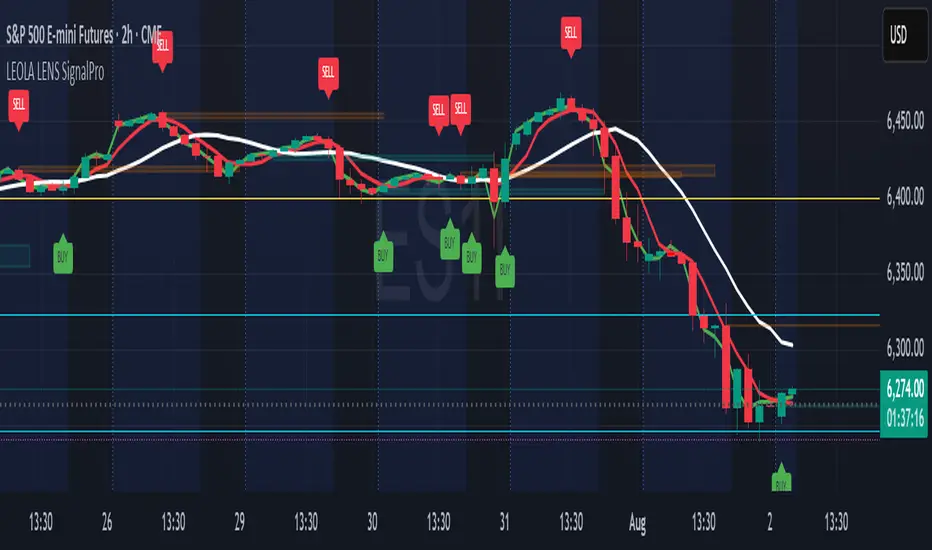
Leola Lens SignalPro📌 Leola Lens SignalPro — Structure-Aware Momentum Overlay (Invite-Only)
This script is designed for traders who prioritize clear structure, liquidity trap zones, and momentum transitions. It provides adaptive visual overlays that align with key decision points — emphasizing structure over lagging indicators.
________________________________________
⚙️ Core Operating Modes
✅ Momentum Shift Mode (Always Active)
Tracks microstructure shifts using volatility compression, imbalance reactions, and adaptive logic for directional bias.
⚡ Scalper Mode (Optional)
Activates fast-response overlays for 1m–15m charts — tuned for crypto, indices, and intraday setups.
🛡 Safeguard Mode (Optional)
Applies volume and exhaustion filters for higher timeframe or conservative entries, ideal for swing traders.
________________________________________
📦 Liquidity Control Box (LCB) Logic
🔵 Blue Box = Bullish Control
• Break above → continuation likely
• Break below → caution for reversal
🟧 Orange Box = Bearish Control
• Break below → continuation likely
• Break above → caution for squeeze
Use the last visible box for bias.
Box edges = confluence zones.
Box overlaps = consolidation → avoid impulsive trades.
________________________________________
🧠 Signal Logic & Concept
Built using a custom structural engine, not derived from public scripts like RSI, MACD, or WaveTrend.
The overlays aim to capture price behavior often aligned with institutional concepts, such as:
• Order Blocks
• Liquidity Sweeps
• Trap Reversals
• Mitigation Moves
Pairs well with SMC-style analysis and order-flow-based trading.
________________________________________
🟡 Visual Signal Layers
• BUY / SELL Labels → Appear near structure flips and trap zones
• Yellow Label → High-risk trend shift zone
• LCB Boxes → Real-time market control zones
• Green/Red Liquidity Zones → Absorption or rejection
• MA Overlays → Adaptive slope-based guidance (optional)
• Pink Lines → High-reactivity reversal zones
• Yellow Line → Soft S/R (psychological pivot)
________________________________________
🎯 Suggested Entry & Exit Cues (Educational Use Only)
✅ Entry
• BUY near Blue LCB + liquidity reaction
• SELL after extended rallies into Orange LCB + trap behavior
• ⚠ Avoid trades directly at Yellow Labels unless other context supports
✅ Exit
• On opposite label after structure break
• On formation of opposite LCB
• Near major liquidity zones or pink levels
🧪 Always backtest label behavior to fit your strategy before use.
________________________________________
🔍 Originality Justification
This script introduces a non-indicator-based approach to structure detection — combining real-time volatility response, adaptive liquidity logic, and multi-mode filtering. It avoids conventional oscillators in favor of clarity-driven visual overlays, offering a novel experience especially useful to discretionary traders.
________________________________________
⚠️ Disclaimer
This script is for educational and informational purposes only. It does not constitute financial advice or a trading signal. Always validate performance with backtesting and forward testing before live use.
________________________________________
Leola Lens Footprint📌 Leola Lens Footprint — Market Memory Overlay (Invite-Only)
This invite-only script is built to visualize market memory by identifying historically reactive zones — where price previously encountered resistance, support, or decision-making friction.
Unlike predictive models or indicator-driven systems, Footprint focuses only on price behavior that has already occurred, using confirmed reaction clusters to highlight likely areas of future influence.
________________________________________
🔍 What It Does
• Detects zones where price has reacted multiple times, showing clear rejection, breakout, or consolidation behavior
• Plots these levels only after market confirmation — no projections or lagging indicators
• Designed for clean structural reading across all timeframes and asset classes (crypto, stocks, forex, commodities)
________________________________________
🟡 Visual Elements
• 🟣 Purple Zones → High-impact memory zones with consistent historical rejection
• 🟤 Brown Zones → Fresh rejection clusters (recent demand/supply zones)
• 🟡 Yellow Line → Psychological pivot zone/Key decision points formed from repeated reactions.
• 🩷 Pink Lines → Pullback or reversal zones (support/resistance traps)
• Adaptive zone shading and slope-based logic enhances readability
________________________________________
📊 Best Suited For:
• Price-action traders who focus on confirmed historical behavior, not speculative levels
• Scalpers and swing traders looking to trade retests and rejection entries
• Discretionary traders wanting a stable visual map of structure without noise
________________________________________
🔧 Originality & Logic
This script uses original rule-based logic to cluster and validate levels only after real-world confirmation.
It does not use RSI, MACD, MAs, volume, or any traditional indicator input.
Instead, it tracks zone memory based on how price respects or invalidates key levels over time — making it adaptive to both trending and ranging environments.
There is no repainting or forward projection — all levels appear only after market structure confirms relevance.
________________________________________
⚠️ Disclaimer
This tool is for educational and informational purposes only. It does not constitute trading advice or a financial recommendation. Always validate visual overlays with your own risk framework and backtesting before live use.
________________________________________

Leola Lens Pro📌 Leola Lens Pro — Expansion, Trap & Structure Map (Invite-Only)
This invite-only overlay is designed to give traders enhanced clarity around liquidity shifts, trap zones, and expansion/reversion mechanics — across all timeframes and market types.
Built as an evolution of Leola Lens Standard, the Pro version integrates a more refined structural engine to highlight real-time reaction zones with greater context sensitivity.
________________________________________
🔍 What It Displays
• Dynamic support/resistance zones that evolve with price
• Expansion & reversion levels — visualize where moves may exhaust or reverse
• Liquidity sweep detection to catch trap-based market setups
• Cluster zones that signal areas prone to breakouts or failed entries
________________________________________
🟡 Visual Markers
• 🟡 Yellow Line → Psychological pivot zone
• 🩷 Pink Lines → Pullback or reversal zones (support/resistance traps)
• Adaptive zone shading and slope-based logic enhances readability
________________________________________
📊 Best Suited For:
• Traders identifying value breaks, imbalance zones, or liquidity voids
• Scalpers catching early trap setups before momentum expands
• Swing traders aiming to enter mean reversion trades post-expansion
________________________________________
🔧 Technical Approach & Originality
Leola Lens Pro is powered by original proprietary logic — it does not rely on public Pine scripts, built-in indicators, or volume-based techniques.
• No use of RSI, MACD, MAs, Bollinger Bands, or volatility indicators
• Not a predictive tool — it responds to confirmed structure, slope, and price reaction
• Designed for clarity in both trending and ranging conditions
• Visual performance optimized for 15-minute charts but remains timeframe-agnostic
This implementation provides a novel overlay experience focused on structural adaptability and trap awareness, not traditional indicator signals.
________________________________________
⚠️ Disclaimer
This script is provided for educational and analytical purposes only. It does not constitute financial advice or trade recommendations. Always validate tools through personal testing and risk frameworks.
________________________________________

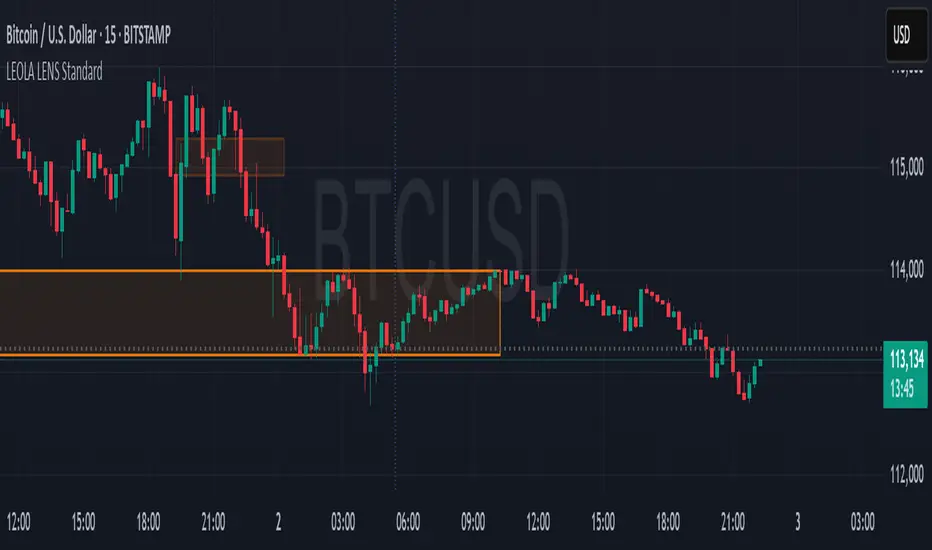
Leola Lens Standard📌 Leola Lens Standard — Structural Reaction Map (Invite-Only)
Leola Lens Standard is a closed-source overlay designed to map structural levels, reaction zones, and liquidity shifts — across all major market types and timeframes.
This version focuses on clean, adaptive visuals that help traders identify reaction-prone areas without relying on conventional indicators.
________________________________________
🔍 What It Displays
• Dynamic zones that shift based on evolving price behavior
• Support and resistance clusters around consolidation or expansion phases
• Upper and lower range boundaries to track accumulation/distribution conditions
• Transition zones where false breakouts or traps are likely to occur
________________________________________
🧠 Technical Approach & Originality
This tool uses custom-coded structural logic, not derived from Pine Script libraries or public indicator templates.
• No use of RSI, MACD, MAs, Bollinger Bands, or volume-based profiles
• Reactions are mapped based on confirmed price behavior, not forecasts
• All zones are generated visually — no manual inputs required
• Compatible with trend, range, or chop market conditions
Its focus on structure-based clarity helps traders cut through noise, particularly in high-volatility environments.
________________________________________
🧩 Best Use Cases
• Intraday traders seeking traps and fakeouts at key levels
• Swing traders mapping range-to-trend transitions or retests
• Market-neutral setups where visual structure is more actionable than signal indicators
• Works across crypto, equities, forex, and commodities
________________________________________
⚠️ Disclaimer
This script is provided for educational and analytical purposes only. It is not financial advice and should not be used to make trading decisions without proper risk assessment.
________________________________________
MA Crossover Detector
The Moving Average Crossover Detector is a custom indicator that visually shows buy and sell signals clearly on the chart. based on the crossing of two moving averages — a popular and beginner-friendly tool in technical analysis.
It plots two moving averages — One fast (short period) and one slow (long period) — and highlights crossover points:
✅ Buy Signal (Golden Cross) – When the fast MA crosses above the slow MA.
❌ Sell Signal (Death Cross) – When the fast MA crosses below the slow MA.
✅ Features
Visual: Clearly shows crossovers on the chart.
Customizable: Choose periods, types, styles, etc.
Alert-ready: You can set alerts for crossovers.
The Moving Average (MA) Crossover Strategy is one of the simplest and most widely used strategies in technical analysis for trading stocks, forex, crypto, and other markets. It relies on the interaction between two moving averages to generate buy and sell signals.
Core Components
Short-Term Moving Average (Fast MA) : Reacts quickly to price changes (e.g., 9-period or 20-period).
Long-Term Moving Average (Slow MA) : Reacts more slowly to price changes (e.g., 21-period or 200-period).
How the Strategy Works
Bullish Crossover (Golden Cross):
Occurs when the fast MA crosses above the slow MA. Interpreted as a buy signal, indicating a potential uptrend.
Bearish Crossover (Death Cross):
Occurs when the fast MA crosses below the slow MA. Interpreted as a sell signal, indicating a potential downtrend.
Common Variants
Short-term trading
9 EMA
21 EMA
Swing trading
20 SMA
50 SMA
Long-term investing
50 SMA
200 SMA
Pros
Easy to understand and implement
Works well in trending markets
Can be automated for backtesting and execution
Cons
Lagging indicator: MAs are based on past prices, so signals come after the move has started.
Choppy markets = whipsaws: Generates false signals in sideways/range-bound conditions.
May underperform in volatile or mean-reverting environments
Tips for Improvement
Use confirmation tools : e.g., RSI, MACD, volume analysis, price action
Add filters : Trend filter (ADX), volatility filter (ATR), or time filter (session-based)
Combine with price structure : Support/resistance, breakouts, pullbacks

TPC Strategy XAUUSD - M5 with Fixed SL/TPThis script implements a trend-following strategy for XAUUSD on the 5-minute chart, using 200 EMA and 21 EMA to filter direction. Entries are triggered based on RSI, MACD crossovers, and price action alignment. It includes fixed Stop Loss (15 pips) and Take Profit (22.5 pips) with visual SL/TP lines, BUY/SELL labels, and alert conditions for automated notifications. Designed for intraday scalping and low-risk entries during trending conditions.
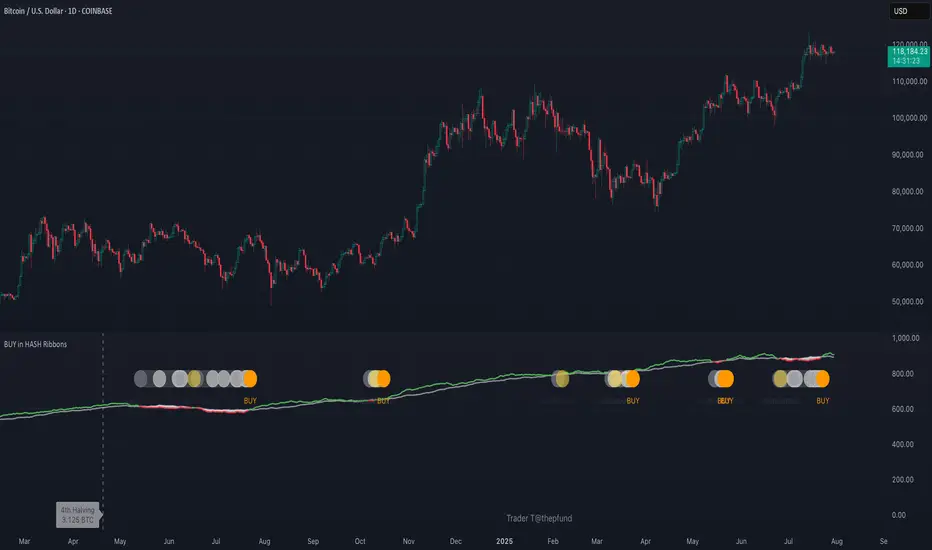
BUY in HASH RibbonsHash Ribbons Indicator (BUY Signal)
A TradingView Pine Script v6 implementation for identifying Bitcoin miner capitulation (“Springs”) and recovery phases based on hash rate data. It marks potential low-risk buying opportunities by tracking short- and long-term moving averages of the network hash rate.
⸻
Key Features
• Hash Rate SMAs
• Short-term SMA (default: 30 days)
• Long-term SMA (default: 60 days)
• Phase Markers
• Gray circle: Short SMA crosses below long SMA (start of capitulation)
• White circles: Ongoing capitulation, with brighter white when the short SMA turns upward
• Yellow circle: Short SMA crosses back above long SMA (end of capitulation)
• Orange circle: Buy signal once hash rate recovery aligns with bullish price momentum (10-day price SMA crosses above 20-day price SMA)
• Display Modes
• Ribbons: Plots the two SMAs as colored bands—red for capitulation, green for recovery
• Oscillator: Shows the percentage difference between SMAs as a histogram (red for negative, blue for positive)
• Optional Overlays
• Bitcoin halving dates (2012, 2016, 2020, 2024) with dashed lines and labels
• Raw hash rate data in EH/s
• Alerts
• Configurable alerts for capitulation start, recovery, and buy signals
⸻
How It Works
1. Data Source: Fetches daily hash rate values from a selected provider (e.g., IntoTheBlock, Quandl).
2. Capitulation Detection: When the 30-day SMA falls below the 60-day SMA, miners are likely capitulating.
3. Recovery Identification: A rising 30-day SMA during capitulation signals miner recovery.
4. Buy Signal: Confirmed when the hash rate recovery coincides with a bullish shift in price momentum (10-day price SMA > 20-day price SMA).
⸻
Inputs
Hash Rate Short SMA: 30 days
Hash Rate Long SMA: 60 days
Plot Signals: On
Plot Halvings: Off
Plot Raw Hash Rate: Off
⸻
Considerations
• Timeframe: Best applied on daily charts to capture meaningful miner behavior.
• Data Reliability: Ensure the chosen hash rate source provides consistent, gap-free data.
• Risk Management: Use alongside other technical indicators (e.g., RSI, MACD) and fundamental analysis.
• Backtesting: Evaluate performance over different market cycles before live deployment.
Max Profit Min Loss Options Strategyoption when to buy and sell calls and puts indicator. it uses the rsi macd and volume indicators. it has high profit and low loses
Divergence Indicator with Multi-Length Pivot DetectionThis Pine Script, titled “Divergence Indicator with Multi-Length Pivot Detection”, tool that detects both regular and hidden divergences between price action and an oscillator (defaulting to close, but configurable). It features multi-length pivot logic, angle-based validation, no-cross filtering, and OB/OS region filtering, making it a robust and precise divergence engine. Below is a detailed breakdown:
⸻
🔧 Inputs and Configuration
• osc_src: Oscillator source (e.g. close, RSI, MACD).
• show_hidden: Toggles detection of hidden divergences.
• min_*_angle settings: Control the minimum angle thresholds (in degrees) for confirming valid divergences (ensures momentum is strong enough).
• validate_no_cross: Ensures oscillator and price slopes don’t “cross” the actual values (i.e. filters out invalid or messy trends).
• oversold_level, overbought_level: Used when use_ob_os_filter is enabled to require oscillator to be in OS/OB zones for regular divergence.
• min_div_length: Minimum distance in bars between previous and current pivot points.
⸻
🔁 Internal Engine Mechanics
1. Pivot Detection Engine (Phase 1: Historical Memory)
• For all combinations of left1 and right1 in the range :
• Records all valid pivot lows and pivot highs.
• Stores their:
• bar index
• price value
• oscillator value
This forms a “memory buffer” of past pivots that future price pivots are compared against.
2. Current Pivot Detection (Phase 2: Scanning)
• Loops through larger pivot configurations (left2 ∈ , right2 = 1) to detect new current pivots.
• For each new pivot, it compares against the historical pivots from phase 1.
⸻
📐 Slope and Angle Calculation
For each matching pivot pair (historical vs current):
• Price and Oscillator Slopes are calculated via linear regression, producing:
• price_angle
• osc_angle
• These are converted using math.atan() and math.todegrees() to get proper angular direction and intensity of trend.
⸻
🧠 Divergence Logic
✅ Bullish Divergence
• Regular Bullish: Price makes a lower low, oscillator makes a higher low.
• Hidden Bullish: Price makes a higher low, oscillator makes a lower low.
• Conditions:
• Must meet minimum angle thresholds.
• Optional: Must be in oversold region (osc_src < oversold_level).
• If validate_no_cross is enabled, linearly interpolated slope must not be violated.
✅ Bearish Divergence
• Regular Bearish: Price makes a higher high, oscillator makes a lower high.
• Hidden Bearish: Price makes a lower high, oscillator makes a higher high.
• Conditions mirror the bullish case (with polarity reversed).
⸻
🖍️ Visualization
• Draws colored lines between pivots for visual clarity:
• Green: Regular Bullish
• Lime: Hidden Bullish
• Red: Regular Bearish
• Maroon: Hidden Bearish
• Uses plotshape() to mark divergence bars:
• Triangle-up for bullish
• Triangle-down for bearish
The lines and shapes help quickly identify divergence zones with strong momentum structure.
⸻
🧪 Filtering Enhancements
• No Cross Slope Filter: Checks that oscillator and price values stay above/below their respective slope lines throughout the interval.
• OB/OS Filter: Restricts divergence signals to occur only in oversold/overbought conditions for regular divergences.
• Signal Thinning: Keeps line count to 100 using array.shift() and line.delete().
⸻
🧬 Design Philosophy
• Built to mimic institutional-grade divergence detection, avoiding common false positives.
• Uses adaptive pivots, rigorous angle validation, and noise filtering.

Flexi MA Heat ZonesOverview
Flexi MA Heat Zones is a powerful multi-timeframe visualization tool that helps traders easily identify trend strength, direction, and potential zones of confluence using multiple moving averages and dynamic heatmaps. The indicator plots up to three pairs of customizable moving averages, with color-coded heat zones to highlight bullish and bearish conditions at a glance.
Whether you're a trend follower, mean-reversion trader, or looking for visual confirmation zones, this indicator is designed to offer deep insights with high customizability.
⚙️ Key Features
🔄 Supports multiple MA types: Choose from EMA, SMA, WMA, VWMA to suit your strategy.
🎯 Six moving averages: Three MA pairs (MA1-MA2, MA3-MA4, MA5-MA6), each with independent lengths and colors.
🌈 Heatmap Zones: Dynamic fills between MA pairs, changing color based on bullish or bearish alignment.
👁️🗨️ Full customization: Enable/disable any MA pair and its heatmap zone from the settings.
🪞 Transparency controls: Adjust the visibility of heat zones for clarity or stylistic preference.
🎨 Color-coded for clarity: Bullish and bearish colors for each heat zone pair, fully user-configurable.
🧩 Efficient layout: Smart use of grouped inputs for easier configuration and visibility management.
📈 How to Use
Use the MA1–MA2 and MA3–MA4 zones for longer-term trend tracking and confluence analysis.
Use the faster MA5–MA6 zone for short-term micro-trend identification or scalping.
When a faster MA is above the slower one within a pair, the fill turns bullish (user-defined color).
When the faster MA is below the slower one, the fill turns bearish.
Combine with price action or other indicators for entry/exit confirmation.
🧠 Pro Tips
For trend-following strategies, consider using EMA or WMA types.
For mean-reversion or support/resistance zones, SMA and VWMA may offer better zone clarity.
Overlay with RSI, MACD, or custom entry signals for higher confidence setups.
Use different heatmap transparencies to visually separate overlapping MA zones.

BullishSpotAI Smart Signals - EnhancedBullishSpotAI Smart Signals – Invite-Only Version
This script is a multi-layered technical analysis tool designed to help traders identify potential high-probability entry and exit zones based on a combination of trend, momentum, and volatility signals.
🔹 Key Features:
EMA Cross Logic: Detects momentum shifts using fast and slow exponential moving averages.
Multi-Indicator Confirmation: Combines conditions based on RSI, MACD, and ADX to validate trend strength and reduce false signals.
Auto-Generated Trade Levels: Automatically plots estimated entry, stop loss (SL), and multiple take profit (TP) levels on the chart for visual clarity.
Adaptive Parameters: Adjusts calculation settings based on the selected timeframe to better align with different trading styles.
🔹 Compatible With:
Scalping
Day Trading
Swing Trading
🔹 Additional Functionalities:
Built-in alerts for potential long and short opportunities.
Optional visualization of extended price zones to support trade planning.
📌 This invite-only script is closed-source. While the exact logic is not publicly disclosed, the description outlines its core mechanisms and the type of analysis it performs.
⚠️ This tool is not a guarantee of future results and should be used in conjunction with sound risk management and personal judgment. It is intended to support technical decision-making, not to replace it.

S&R Zones MTF (TechnoBlooms)S&R Zones MTF – Multi-Timeframe Support & Resistance Boxes
🔍 Overview
S&R Zones MTF is a professional-grade yet beginner-friendly indicator that dynamically plots Support & Resistance zones across multiple timeframes, helping traders recognize high-probability reversal areas, entry confirmations, and price reaction points.
This tool visualizes structured zones as colored boxes, allowing both new and experienced traders to analyze multi-timeframe confluence with ease and clarity.
🧠 What Is This Indicator?
S&R Zones MTF automatically detects the most significant support and resistance levels from up to four custom timeframes, using a configurable lookback period. These zones are displayed as colored horizontal boxes directly on the chart, making it easy to:
Spot where price has historically reacted
Identify potential reversal or breakout zones
Confirm entries with institutional-style precision
🛠️ Key Features
✅ Multi-Timeframe Zone Detection (up to 4 timeframes)
📦 Auto Plotted Boxes for Support (Blue) & Resistance (Pink)
🧱 Dynamic Height based on average price range or fixed input
🏷️ Timeframe Labels to instantly identify zone origin
🎛️ Customizable inputs: Lookback length, box color, height style
🔁 Real-time updates as price structure changes
🎓 Educational & Easy to Use
Whether you’re a new trader learning about price structure, or a professional applying institutional concepts, this tool offers an educational layout to understand:
How price respects historic zones
Why multi-timeframe zones offer stronger confluence
How to use zones for entry, exit, or risk placement
📈 How to Use (Multi-Timeframe Strategy)
Select Your Timeframes – Customize up to 4 higher timeframes (e.g., 1m, 5m, 15m, 1h).
Observe Overlapping Zones – When multiple timeframes agree, those zones are more significant.
Entry Confirmation – Wait for price to reach a zone, then look for reversal patterns (engulfing candle, pin bar, etc.)
Combine with Other Tools – Use alongside indicators like RSI, MACD, or Order Blocks for added confidence.
💡 Pro Tips
Zones from higher timeframes (1H, 4H) are often more powerful and reliable.
Confluence matters: If a 15m support zone aligns with a 1H support zone — that's a high-probability reaction area.
Use break-and-retest strategies with zone rejections for sniper entries.
Enable "Auto Height" for a more adaptive, volatility-based zone display.
🌟 Summary
S&R Zones MTF blends precision, clarity, and professional analysis into a visual structure that’s easy to understand. Whether you're learning support & resistance or optimizing your MTF edge — this tool will bring clarity to your charts and confidence to your trades.

CVD Divergence + Volume HMA RSI MACD StrategyHow the script works:
The script calculates the HMA for trend direction. The HMA (shown in orange) is used as a filter: long trades are taken only if price is above the HMA, and short trades when below.
The CVD is computed by cumulatively adding volume on up bars and subtracting volume on down bars.
Pivot routines (with the input "Pivot Length") detect swing lows/highs for both price and CVD. A bullish divergence is flagged when the price makes a lower low while the CVD makes a higher low. Similarly, a bearish divergence is flagged when the price makes a higher high while the CVD makes a lower high.
Trading is triggered when the divergence condition also agrees with the HMA filter.
Feel free to further adjust the parameters or add risk‐management/exit rules as needed for your trading style.

Advanced Hurst Cycle + VTL + Turning Points| Timeframe | Cycle Base | Use Case | Notes |
| ------------ | ---------- | ------------------ | ------------------------- |
| 5-min | 16–20 bars | Intraday scalping | Tight SL, fast moves |
| 15-min / 1hr | 20–40 bars | Intraday to swing | Good for options intraday |
| Daily | 20–40 bars | Multi-day swings | Ideal for Futures/ST BTST |
| Weekly | 13–26 bars | Position/Investing | For macro turns |
Guide to Trading with JM Hurst Cycles in TradingView
1. What is JM Hurst Cycle Theory?
JM Hurst proposed that financial markets move in harmonically related cycles. These cycles can help traders
forecast turning points in markets using time-based analysis rather than just price.
Key Concepts:
- Cycle Nesting: Smaller cycles exist within larger ones.
- Harmonic Ratios: Each cycle is typically double the length of the smaller one (e.g., 20, 40, 80).
- Turning Points: When multiple cycles bottom together, strong reversals occur.
- Tools: FLD (Future Line of Demarcation), VTL (Valid Trend Lines).
2. TradingView Script Features
The provided Pine Script v5 implements:
- FLDs (shifted SMAs) for base and harmonic cycles.
- VTLs: Drawn between major pivot highs/lows to confirm trend reversals.
- Cycle Turning Points: Detected using pivot logic and cycle phase.
- Optional: Sine wave to visualize cycle rhythm.
Inputs:
- Base Cycle Length: Set the expected cycle duration (e.g., 20 bars).
- FLD/VTL/Turn toggles to customize chart view.
3. How to Trade with This Script
1. Set 'Base Cycle Length' to 20, 40, or 80 depending on your market and timeframe.
2. Watch for price crossing the FLD:
- Bullish Signal: Price crosses above FLD near cycle bottom.
- Bearish Signal: Price breaks below FLD near cycle top.
3. Use VTL for confirmation:
Guide to Trading with JM Hurst Cycles in TradingView
- Break of upward VTL from cycle lows = bearish shift.
- Break of downward VTL from cycle highs = bullish shift.
4. Use turning point markers:
- Triangle up (green): Probable cycle bottom - watch for long.
- Triangle down (red): Probable cycle top - prepare for exit or short.
Tips:
- Align multiple cycle lengths for stronger confirmation.
- Use with other technical indicators like RSI/MACD for confluence.
- Avoid trading just before major news events - cycles can distort.
4. Example Strategy
If base cycle is 20 bars:
- Wait for triangle up (cycle low) near FLD.
- Confirm price crosses above FLD.
- Ensure VTL from prior lows is intact or just broken upward.
- Enter long; set stop below recent low.
Opposite for shorts at triangle down + FLD break down + VTL break.
5. Final Notes
This script offers a time-based visual trading method inspired by JM Hurst. It's most powerful when used with
patience, confirmation, and alignment across cycles.
You can adjust cycle lengths or refine pivots based on your trading timeframe and asset class.
For best results, backtest cycle behavior on your instrument before live trading.
